Harmonicity function
I've been struggling to create a function that returns how harmonic a frequency is in relation to some other frequency; or in other words, a function of harmonicity of a frequency.
Many sources mention the harmonic series. According to this model, we can find the most harmonic frequencies in sequency by dividing the frequency over incrementing integer numbers (i.e. 440 * 1/2, 440 * 1/3, 440 * 1/4, 440 * 1/5 and so on). The greater the denomitator is, the less harmonic the frequency is found to be in relation to the initial frequency.
There is one problem with the harmonic series, though: it doesn't take into account that frequencies that are close enough numerically, also tend to cause a perception of harmony. This is the underlying principle under equal temperament: although the frequencies in this tuning system are not harmonic, they are close enough to fool most listeners into perceiving the intended frequencies as the same. Each listener might have a different level of tonal discrimination capacity. The same goes for physical systems.
I decided to use the sine function, because thanks to it's periodicity, it is easy to create a function that already represents the harmonicity of a tone and it's octave: y = cos(2 pi x).
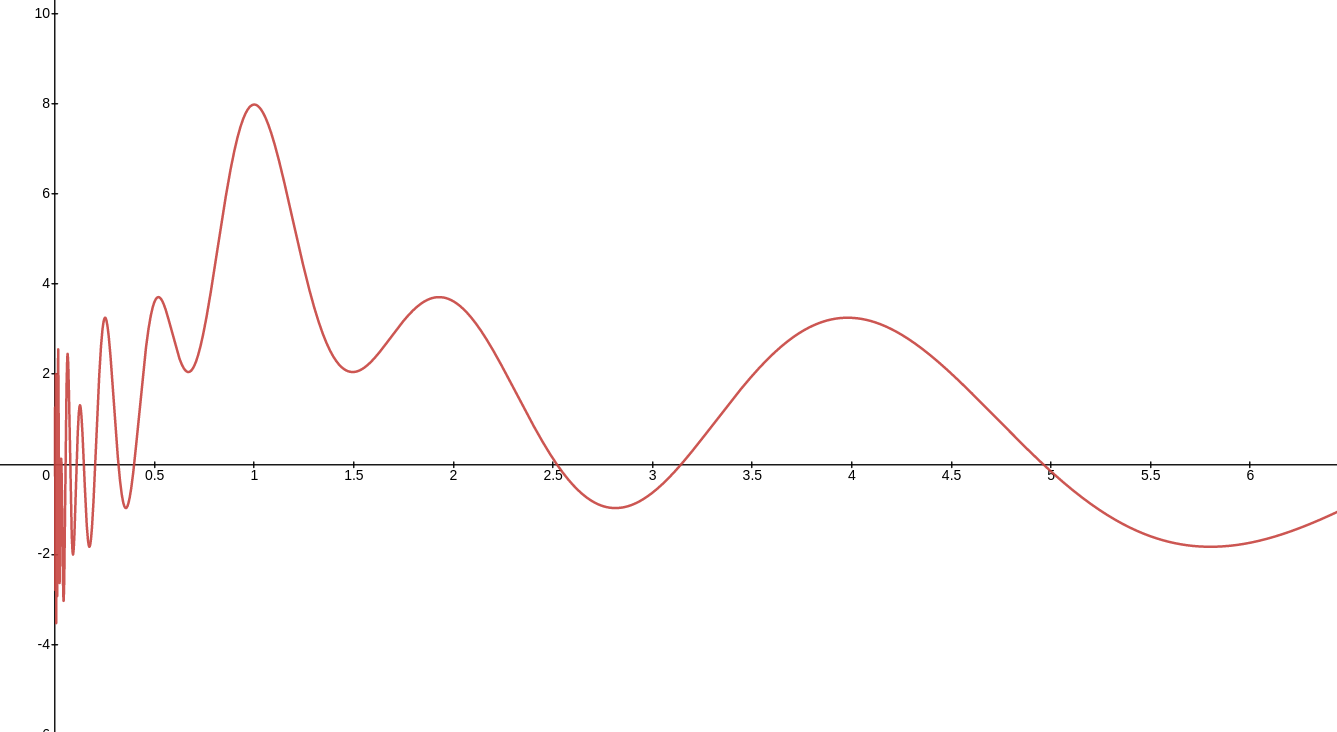
The logic second step is integrating a function to represent the second and third harmonics. Each harmonic should be multiplied by a decreasing number, as they are less harmonic the greater their number is: cos(2 pi x) + 1/2 cos(2 pi x / 2) + 1/3 cos(2 pi x / 3). At this point I realized that I could more easily integrate it all into one sum function:
y=\sum_{n=1}^{r}\frac{1}{n}\cos\left(\frac{2\pi x}{n}\right)`.
Which mapped logarithmically is:
y=\sum_{n=1}^{r}\frac{2}{n}\cos\left(\frac{2\pi\log_{2}\left(\left(x\right)\right)}{n}\right)`
Needs improvement
This function is not quite perfect; the addition of many sine shapes cause the harmonic series to not be represented proportionally. Observe, for example how the third harmonic is almost the same as the second harmonic. Also, how the 1/3 harmonic is quite wrong. We would need to use some other function instead of cosine. One that is not periodic and where the result is zero except for values that are very close. That way, the progressive addition of sines will not cause offset on each harmonic nearness.
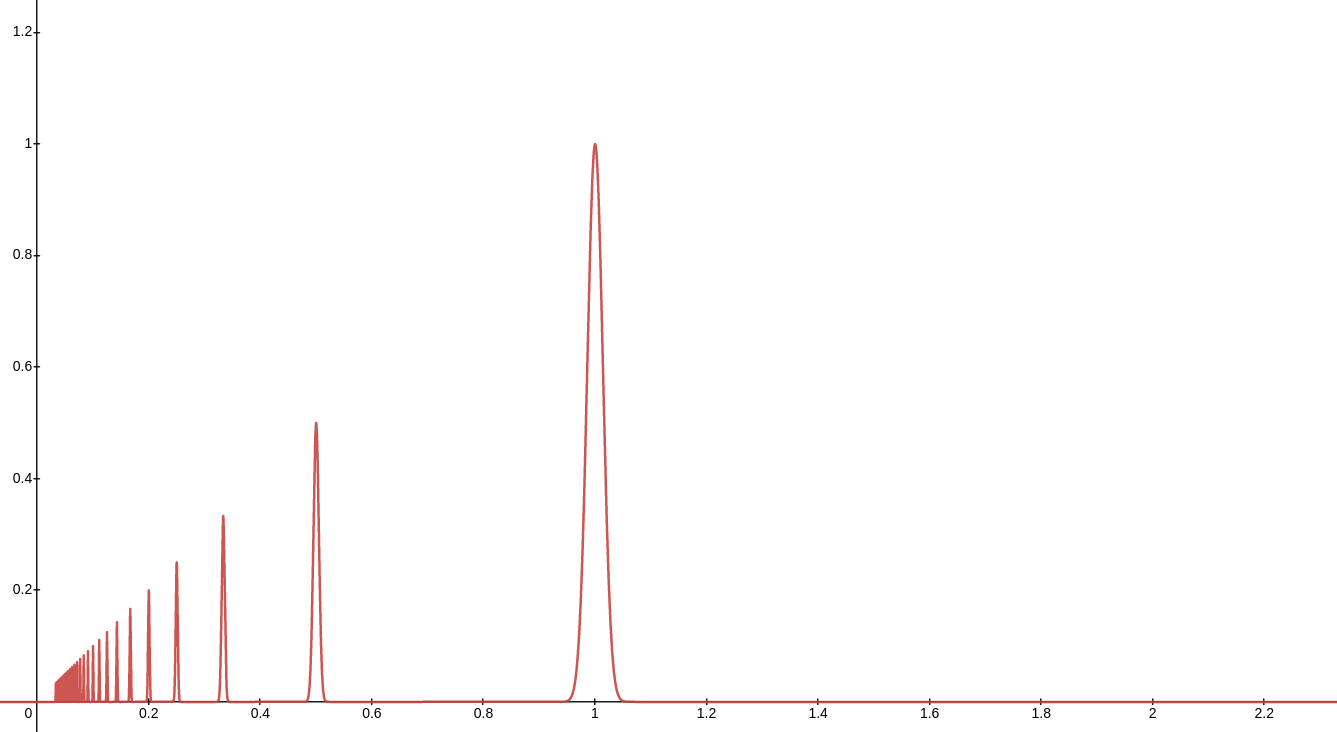
One candidate is the bell curve formula; but this one is quite complex on it's own. The resulting formula is a bit complicated for my taste, and it only covers portions of the frequency, not factors: (see it here). The advantage is that the tone discrimination level can be adjusted.
y=\sum_{n=1}^{r}x\ \cdot2^{-b^{2}\cdot n^{3}\cdot\left(x\ +\frac{1}{-n}\right)^{2}}
In the same way as some listeners might perceive frequencies that are close enough as the same, physical systems might also react to one frequency that is close enough as if it were the same frequency. Think of the metronomes over a table experiment. Presumably different physical systems might have greater tolerance than others to the variance in the frequency; in the same way as different listeners might have a greater or lesser ability to distinguish tones. This means that when it comes to plotting harmonic closeness of one frequency to another, the curves depend heavily on the application. In this plot I have chosen sinewaves because they are easy to utilize and also are the best shape to work with self-optimizing systems, which is interesting for the application I want to give to this function. This function is therefore not readily applicable to every case. It is missing the integration of a tolerance factor.