Renca Urban Projects Map
You can visit it at: rencaciudad.cl/mapa-interactivo/
Project Overview
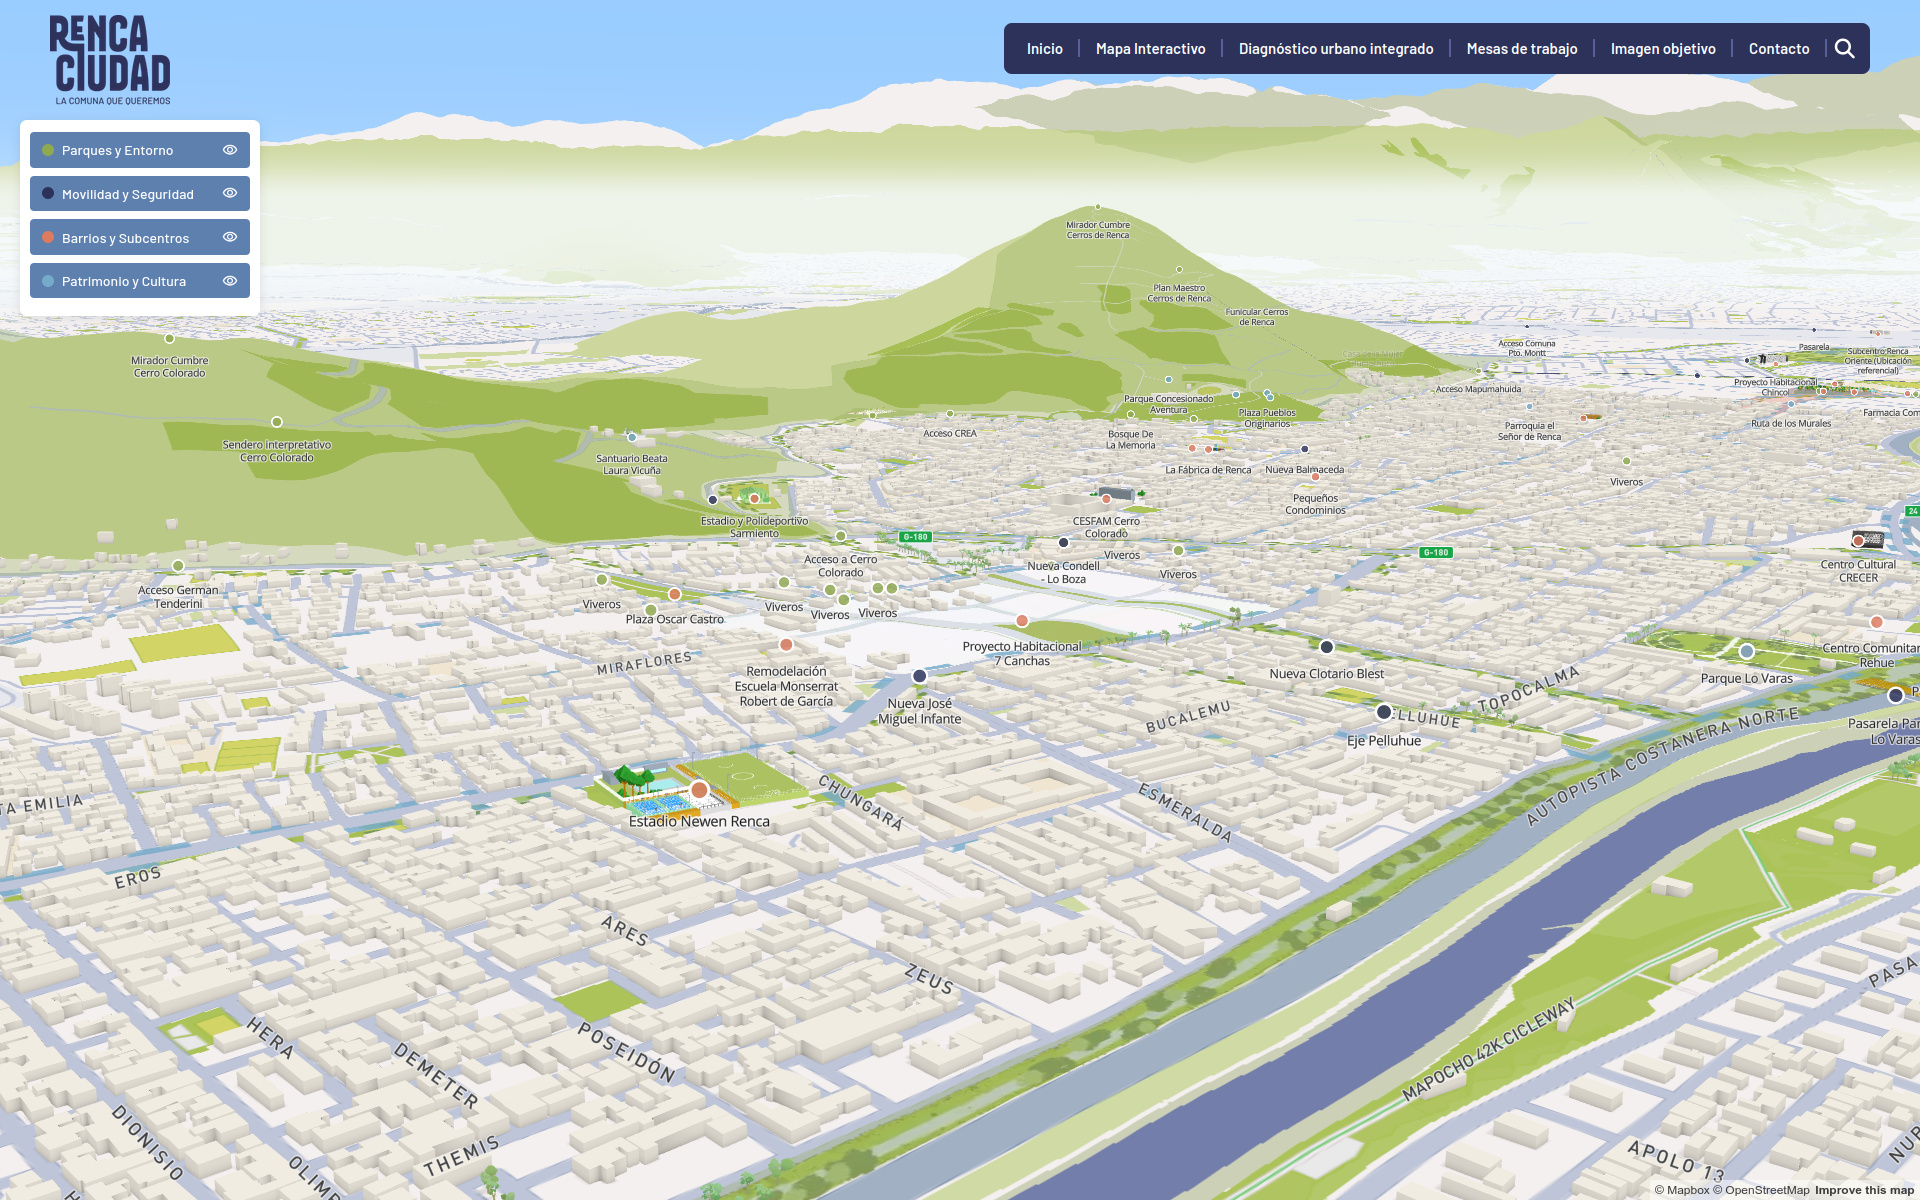
I developed a sophisticated web-based 3D mapping platform for the Municipality of Renca in Santiago, Chile, enabling visitors to visualize and explore over 60 urban development projects through an interactive interface that combines GIS data, satellite imagery, and custom 3D architectural models. The client agency provided the hosted wordpress site, the 3d models and quality assurance.
Client: 2Litros & Renca Municipality (Urban Planning & Communications Agency) Timeline: June - November 2025 Role: Full-Stack Developer & GIS Specialist
The Challenge
Renca municipality needed an innovative solution to present their urban planning initiatives to stakeholders, citizens, and government officials. Traditional static maps and presentations failed to convey the spatial relationships and visual impact of proposed developments. The client required:
- An engaging way to showcase 60+ development projects across different categories (parks, mobility infrastructure, cultural heritage, neighborhoods)
- Integration of 3D architectural models into a geographic context
- Interactive exploration with detailed project information
- Professional presentation-ready visualization
- Real-time data updates from their WordPress CMS
Technical Solution
I architected and developed a custom TypeScript web application that bridges advanced mapping libraries with 3D graphics rendering, creating a seamless interactive experience.
Technology Stack
Frontend Architecture:
- TypeScript with strict mode for type-safe development
- Vite as modern build tool and development server
- Mapbox GL JS for vector map rendering and 3D terrain
- Three.js for WebGL-powered 3D model rendering
- Threebox for seamless Mapbox-Three.js integration
Data & Tools:
- GeoJSON for geographic feature data
- QGIS for geospatial data processing and validation
- Blender for 3D model modifications (models were created by another 3D artist)
- GeoTIFF raster processing for terrain overlays
- Github Copilot to accelerate development
Key Features Implemented
1. Multi-Layer GIS Visualization
Engineered a flexible layer management system supporting:
- 4 major categories with 10+ individual data layers
- The categories are defined by GIS source point files
- Multiple geometry types (points, lines, polygons, custom patterns)
- Dynamic styling with zoom-responsive rendering
- Category-based visibility controls
- Hierarchical sidebar menu with expandable feature lists
2. 3D Model Integration
Built a custom model fetching pipeline that:
- Loads 40+ architectural models in GLTF format
- Automatically positions models based on geographic coordinates
- Calculates precise terrain-relative altitudes
- Implements lighting (ambient + directional)
- Handles graceful degradation when models are unavailable
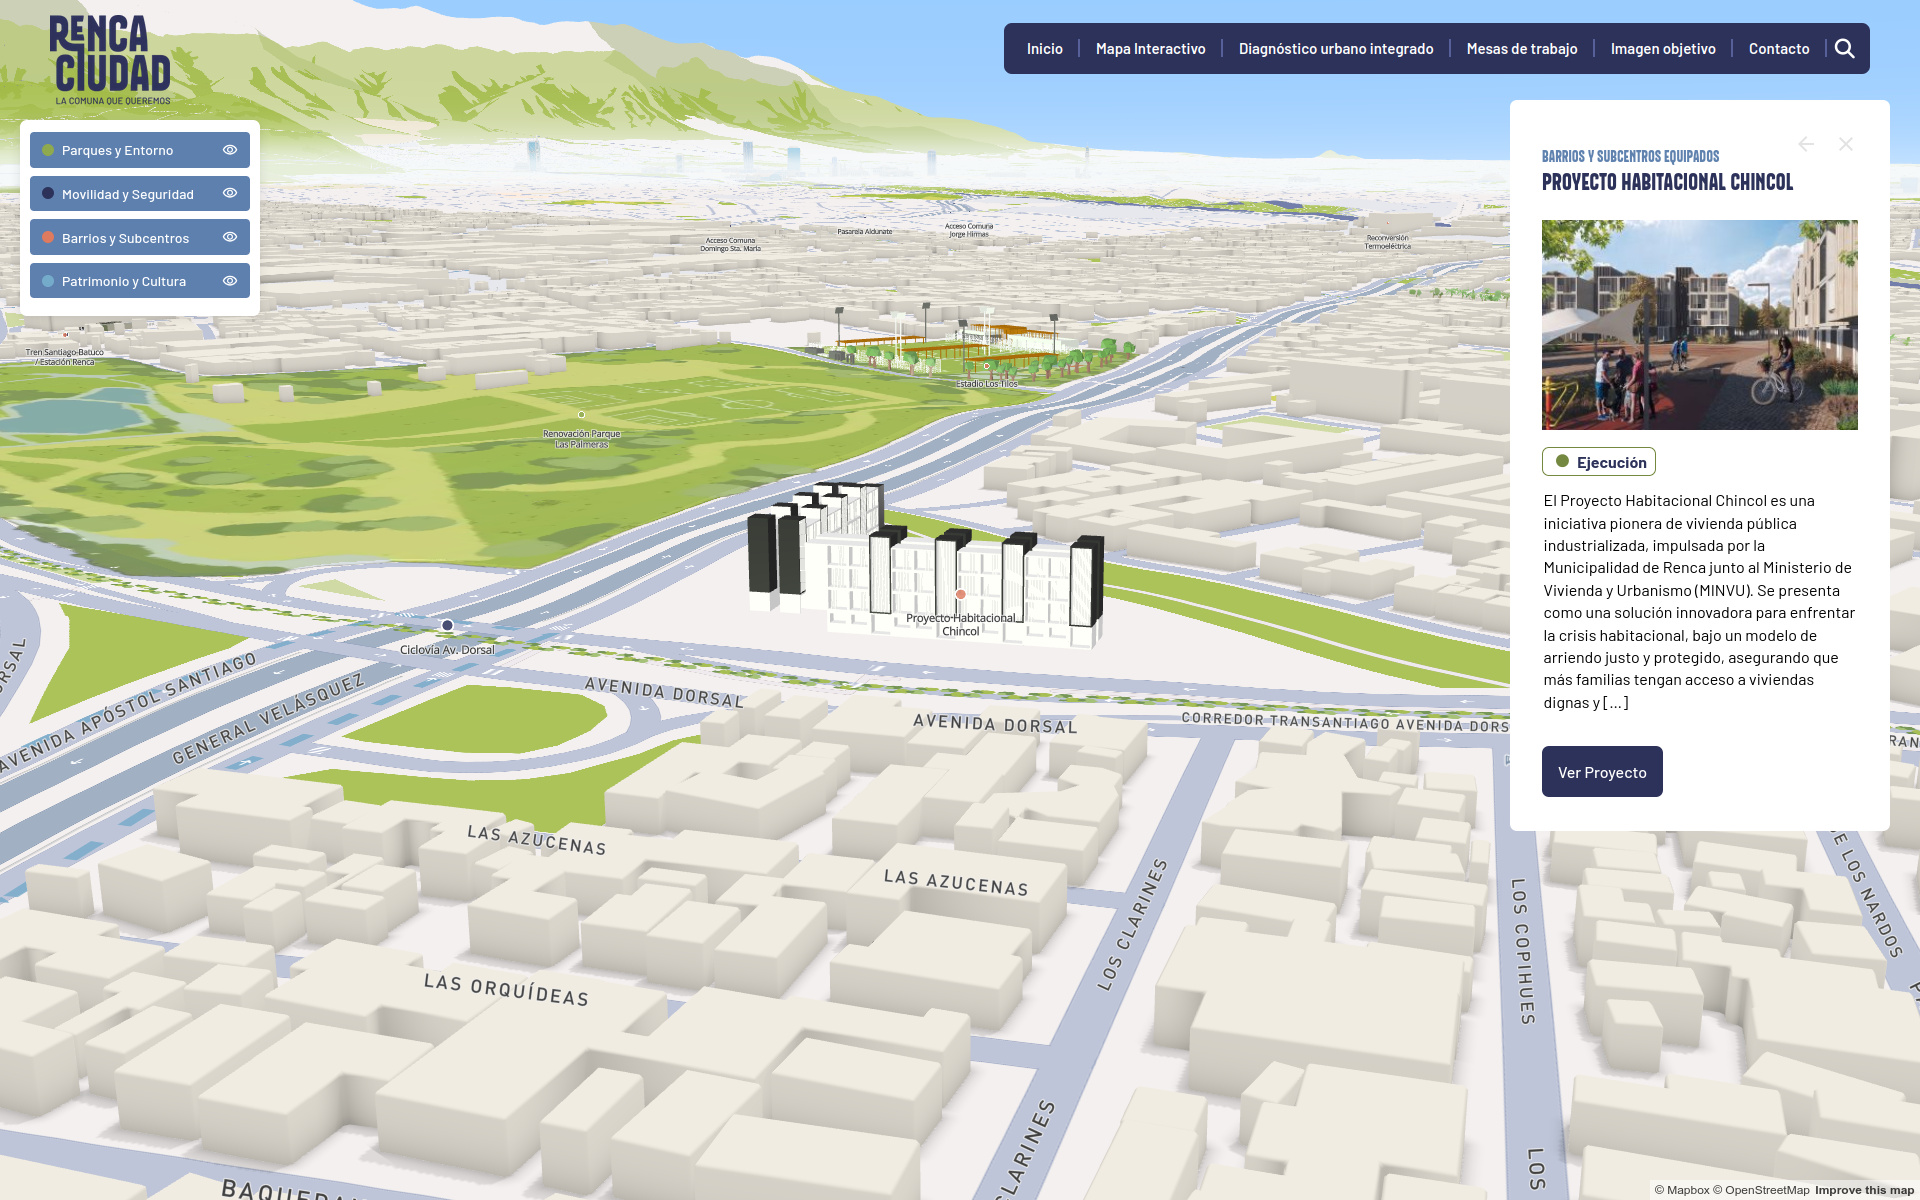
3. Interactive Focused Mode
Camera animation system:
- Smooth fly-to animations with configurable speed
- Context-aware zoom/pitch (overhead for areas, tilted for points)
- Side panel with project details, images, status, and links
- Deep linking support via URL hash routing
4. Real-Time Data Integration
Enabled the modification of data via an JSON API
- Automated fetching of project metadata
- Fuzzy string matching to link CMS content with GIS features
- Automatic image and description population
Technical Challenges Overcome
-
Performance Optimization
- Implemented tile caching (90 max) and deferred 3D model loading
- Optimized layer rendering order for better frame rates
- Reduced API calls with intelligent state management
-
3D Model Alignment
- Developed altitude acquisition system combining manual data, terrain queries, and fallbacks
- Handled model georeferencing and handling of problem cases
-
Data Pipeline
- Built conversion workflow from KMZ (Google Earth) to GeoJSON
- Processed GeoTIFF satellite imagery for park overlays
- Automated model-to-feature matching via naming conventions
-
UX Design
- Created intuitive category-based organization interface
- Implemented search functionality accessible via console
- Designed responsive detail panels with project information
- Added error handling with user-friendly messages
Skills
- Full-Stack Development: TypeScript, Vite, modern web architecture
- GIS & Mapping: Mapbox GL, GeoJSON, coordinate systems, terrain data
- 3D Graphics: Three.js, WebGL, GLTF models, lighting & materials
- API Integration: REST APIs, data serialization, content management
- Geospatial Tools: QGIS, PostGIS, GeoTIFF processing
- Problem Solving: Complex technical integration across multiple domains
- Project Management: Client communication, time tracking, iterative development.