Tuning explorer
Play wih it online at: tuning explorer.
Get the source code: Gitlab universal tuner, spinoff branch.
Finding harmony in binary computer files
I am an Octatrack user, and for me, one of the greatest lacks of the machine is the incapacity to switch between project files without a silent pause in between. While using the Octatrack, one is supposed to hold the whole performance in one project file. The problem is that I often find myself wanting to re-combine banks in a different way to how I originally created them. That is why I started researching about how to crack binary files. The Octatrack binary files are of the simplest possible formats, thankfully, as Elektron's engineers probably targeted stability and read speed over trying to obscure their file format. I assume they actually saw that it would be beneficial if someone else is able to crack their file, though, they probably don't want to spend time documenting it. Octatrack's software is probably written in C, and the file format is an orderly memory dump of all the variables, in plain bytes. Since the Octatrack has many instances of the same thing (for example, it has 16 sequences, all of which have the same parameters), it is likely that one could find repetitive patterns in this binary files, thus, it is possible to find the memory address (how many bytes from the start) of any particular parameter stored.
Anyway, how could one find repetitive patterns on a binary file? The first step was obvious to me: create a binary where all the instances of the same thing would contain the same parameter values, so that I could easily find these patterns as a repetition of the same.
The second step consists on finding these repetitive structures. One way to do this, would be to write a software for pattern matching, probably based on Markov chains. With Markov chains one can find out what are the longest strings of bytes that are repeated more than once, and see which strings of bytes are repeated the most.
There is a faster and more fun approach, though: using our visual cortex to find patterns. There are software tools that let us visualize bytes as pixels, and have a "bytes per row" setting (e.g. Veles or Kentavv's Binary Viewer ). In this way you get the bytes in order, as pixels in the Y axis of the screen. The file, probably has more bytes than the screen has pixels, so, the pixels continue on the next row. Pixels will come adjacent to other pixels, which represent bytes that are otherwise not related. They have 'just fallen there' because of the amount of pixels per row. By changing the pixels per row, by consequence, one can visually correlate pixels according to recurrence. It's a bit hard to explain by text; let me show you an example.
You have the following bytes sequence:
010DA7FE224C050DA7FE224C060DA7FE224C180DA7FE224C0A0DA
7FE224C1B0DA7FE224C050DA7FE224C050DA7FE224C3563
Then you start trying out different "pixels per row"
010DA7FE224C050DA7FE224C060DA7FE224C180D
A7FE224C0A0DA7FE224C1B0DA7FE224C050DA7FE
224C050DA7FE224C3563
ok, nothing...
010DA7FE224C050DA7FE224C060DA7FE224C18
0DA7FE224C0A0DA7FE224C1B0DA7FE224C050D
A7FE224C050DA7FE224C3563
...
010DA7FE224C050DA7FE224C060DA7F
E224C180DA7FE224C0A0DA7FE224C1B
0DA7FE224C050DA7FE224C050DA7FE2
24C3563
010DA7FE224C050DA7FE224C
060DA7FE224C180DA7FE224C
0A0DA7FE224C1B0DA7FE224C
050DA7FE224C050DA7FE224C
3563
oh, cool! I see an alignment. What happens with exactly half the pixels per column?
010DA7FE224C
050DA7FE224C
060DA7FE224C
180DA7FE224C
0A0DA7FE224C
1B0DA7FE224C
050DA7FE224C
050DA7FE224C
3563
Your eyes instantly show you when you have found the right setting. This tells you that there is a recurrent data structure, how many times it repeats, how big it is, and even if there is any particular bit in that structure that changes between repetitions. Besides this, it is really fun to do.
Harmony in binary files and in sound
Now, the interesting thing is that a binary file might have more than one "pixels per column" setting that matches repetitive patterns. First of all, it is likely that a structure shows up on all it's factors (1200 pixels per column will show some repetitive pattern if 2400 does). Also, the file might contain more than one recurrent data structure, that has a different size. Each size would show by using a different pixels per column setting. These two realizations brought me to the topic of harmony.
Waves of frequencies that are harmonic, are going to create patterns that seem to repeat in few periods (I am talking about pure sine tones, here). For example, a note with it's repetition one octave above, cause a repetition on each period of the lowest note's oscillation. Furthermore, the frequencies of two tones, represented as number, share a higher common divisor the more harmonic they are (if you round the frequencies by a factor of human's frequency discerning capabilities, of course). This is why my incursion into cracking binary file formats led me to musical harmony.
Pixels per column in a pretty straightforward sense, is a form of harmonic analysis of a binary file: one is checking the repetition (i.e. oscillation) period of that binary file. What if I could display frequencies in a way that represents harmony in the same way pixels; so that a user could explore aligning frequencies in different ways to discover underlying patterns of harmony? The circle of fifths is an example of this: whilst in harmony (in our western tuning) the octave interval dominates the harmonic cycle, the circle of fifths is a secondary pattern that emerges when we choose "7 semitones per row" instead of the usual 12. This same principle could be used to identify the relationship between any other interval. If we try 6/5 on our 12-TET tuning, we would get no such alignment. However, the number 12 has so many divisors. With this method we could easily find circles of however many tones we want. What is more interesting, is that we could also find harmonic circles present on any other tuning.
Now, since we started speaking about tuning systems, it intuitively felt that the display needed to be not orthogonal, but circular. Actually spiral, so that it is possible to have different "layers" align, but still be able to tell the frequency order. First of all, cyclicity on tuning systems is important because it leads harmonies to have an infinite space of progression. Secondly, it seems that people who like to investigate these things also have a sweet tooth for esoteric displays, and what can be more esoteric than a spiral.
Displaying the harmonically related tones between 5/6 and 5/4 in 12-TET.
While developing this, most of the time has been spent playing with the thing (that was the idea anyway). Configuring the 12-tet to different intervals, and playing hole rows cause some very special sounding harmonies. It is also very nice to be able to visualize, for example, the difference between equal temperament and Ptolemy's approach to the 12 tones scale.
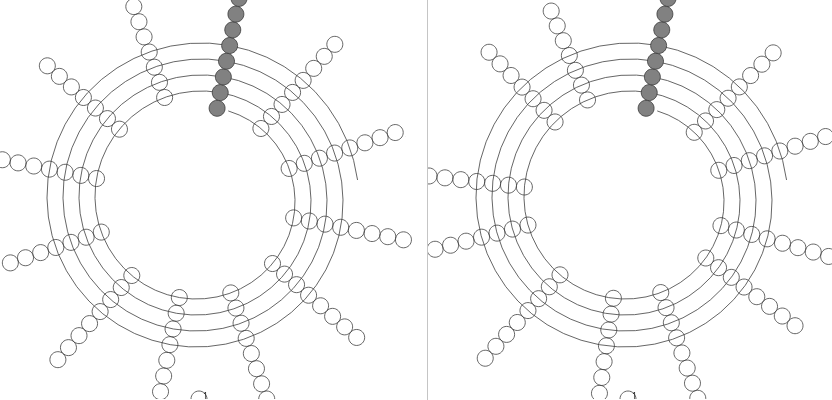
Image showing a comparison between 12-TET versus Ptolemy's 12 tones, respectively. It highlights all the multiples of 55hz.
Frequency list tuning
The most obvious way to input a custom tuning, is utilizing a list of frequencies. This is why the frequencies list was already present in the "universal tuner" project, from where this project spun off. This comes from the assumption that the list of frequencies is the only method for input that is compatible with any method to create a scale; for example, using ratios is good for some scales, but terrible for some other scales such as _n-_TET's. It was a good first step, as this would allow me to potentially create these scales using any method, such as using code scripts.
The frequency list, however, did not lend itself for intuitive play: the process of creating a meaningful scale had too many steps (namely creating a script, running it, and copying the text to the field) as to be something one could play with instant feedback. This led me to the question of other methods for the creation of a tunings.
Scala file upload
I wanted to try scales that people who know about this topic, had created before and listen to them. The first step was creating several buttons that would allow a user to load a pre-existing list of frequencies. I did not go too deep looking for scales, as I assumed that with time these would come to my knowledge.
Following this, I knew that there was a software called Scala, and by a small online search, I realized that the Scala file format is really simple. Furthermore, somebody had already implemented a Javascript code that could be used to parse scl files. I simple forked the repository as to be able to customize the interface.
Ratios
I realized that ratios were one of the most interesting scale creation methods, as ratios can be representations harmony in a physical sense. Furthermore, a controller for a list of ratios is almost the same as the controller for the list of frequencies, only that the numbers had to be converted from rational representation of text (e.g. 3/4) into floating point number (e.g. 0.75). The conversion of rational numbers text into floats could be handled by a library.
I realized that it might be interesting to mix more than one harmony at the same time; such as having a sequence of octaves and a sequence of n * 5/6's, which is why I multiplied the ratios column into three, so that it would be possible to create three intertwined ratio based harmonies, each with their own base frequency. It turned out that it was not that useful, and it would have been more interesting to create some form of creating a secondary harmony that is in relation to the first. One example: the first column is octaves (n) while the second column consists on n * 1/6 and n*3/5 of each frequency produced by the previous column. This could be a bit challenging, though, in terms of user interface, as it would be hard to explain to the user what exactly is happening between one column and the next. It would need some sort of cool gadget that shows these relations spatially.
Formula
Right after creating the ratios based scale making interface, I created a formula based interface. While the ratio based scale making is good for the making of scales such as Ptolemy's 12 tones, there is no easy way to make equally divided scales such as TETs or EDOs. A formula input was also trivial to implement, except that I wanted to parametrize the input of the formula beside plainly calling an eval function on the input, as this is generally frowned upon, as it is dangerous code. Besides, if you are anything like me, you had spent time playing with a graphing calculator and seeing the different way formulas express in a 2d plot. These utilize a different maths syntax than Javascript. I simply utilized a library to parse math formulas. I tried about three, that didn't adapt well to my project, but finally went for Math js.
Tuning by FFT
I am intrigued by the possibility of utilizing FFT to create a tuning. The idea would be to capture sound, and calculate the frequencies of the predominant tones in that sound; then add those frequencies to the scale. The dream, is that it would be possible to create music that capture the character of certain sounds, however, without playing the sound itself. This is one feature that could take a whole day to develop, though.
Tuning peg board
One last thing that I want to implement, but has not yet been done, is creation of scales by tuning with knobs. Some time ago I bought a lap harp, so that I could tune it in arbitrary ways. An experiment I enjoy doing, is to tune one string at random, and then start tuning the other strings one by one, by ear, following what I think that sounds nice in relation to the previously tuned strings. I want to give the option to do this experience to the users by adding an interface that contains some knobs, that can be tuned arbitrarily. I suppose that there must be a toggle to enable repetition across octaves, and the knob would introduce a ratio to the scale. The user, perhaps could be able then to translate his arbitrary tuning into ratios; but what could be most amusing, is to check how the different frequencies move along the spiral while turning the knobs.
Midi
I wanted to integrate these scales into my DAW. Now, very few vst plugins can handle tunings other than 12-TET, and for the ones that support these, the process of tuning them takes many steps. After creating the scale, it would be necessary to translate it into ratios (I created a button in the ratios based editor to do just this, but so far it is not friendly to use) and then create an scl file containing these manually. I was too lazy to create an scl exporter, and besides, Scala software already covers this function. (I hadn't been able to run it in my Linux installation yet). Anyway, I was interested in adding MIDI input to my web experiment.
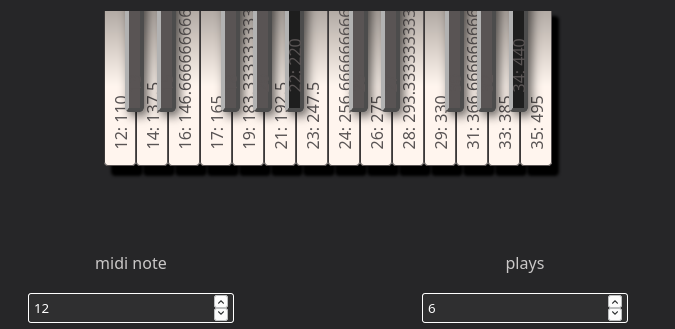
A midi keyboard is mapped to work with a scale that has 8 tones per octave. Consequently, the seven white keys are active, plus only one black key.
After implementing MIDI input, that was as simple as mapping each MIDI note to one consecutive frequency, I realized that, first; a scale could be way out of range (for example all the 127 keys barely cover from infrasonic to bass tones). Secondly, playing on a physical keyboard scales that have more or less than 12 tones is mind-boggling. I therefore added a nice interface that lets the user choose one MIDI note, and to which frequency this MIDI note maps, and also a keyboard setting that lets the user disable MIDI notes (repeated per octave) so that it is possible to have scales with less than 12 tones and have the corresponding octave ratios fall always into what would be an octave in the keyboard, if it was mapped to 12-TET.
After this, I customized the synthesizer a bit more, just so it sounds decent. It was based on sine waves, which sound very nice, but have too few harmonics, so it was hard to make interesting timbres from processing its sound. I also added some settings like attack and decay, plus a control for secondary harmonics. There is a lot of work to do on it's interface and sound, but at least I could now try it with a music setup.
Looking into the future
Creating this experiment led me to questions that I wish to research more in depth, by making more experiments. One of these questions is about user interfaces vs harmony. After playing around musically with just intonations, I wish I could have the same transposition liberty that's granted by 12-tet without having to do the math, or study much. Just with intuition. For this I am sure that it would be possible to create a friendly user interface that represents the harmonic structure among tones, in such way that a user could compose complex pieces with just intonation, or even possibly with any frequency whatsoever. I visualize something that lets the user define structures and move frequencies around while respecting those constraints. The other question is in relation to physical user interfaces; and I am going to contradict something that I wrote just before: depending on the computer to calculate all the harmony for you might leave you with a sensation of powerlessness. Therefore, I would love to learn and device ways to understand these complicated harmonic relationships in hardware; both on electronic and mechanical instruments. I think that it's a real pity that so few synthesizers are only capable of playing equal temperament, and I would like to find ways that just intonation could be used in a very intuitive way, especially for beginners.